Kubernetes搭建ELK + FluentBit + Redis(缓冲队列)
雪域幽狐 2020-05-29 13:30 阅读:10237
ELK作为日志系统的套装,广受喜爱。在日志采集部分,有Logstash、FileBeat、Fluentd、FluentBit等,各有自己的特点。
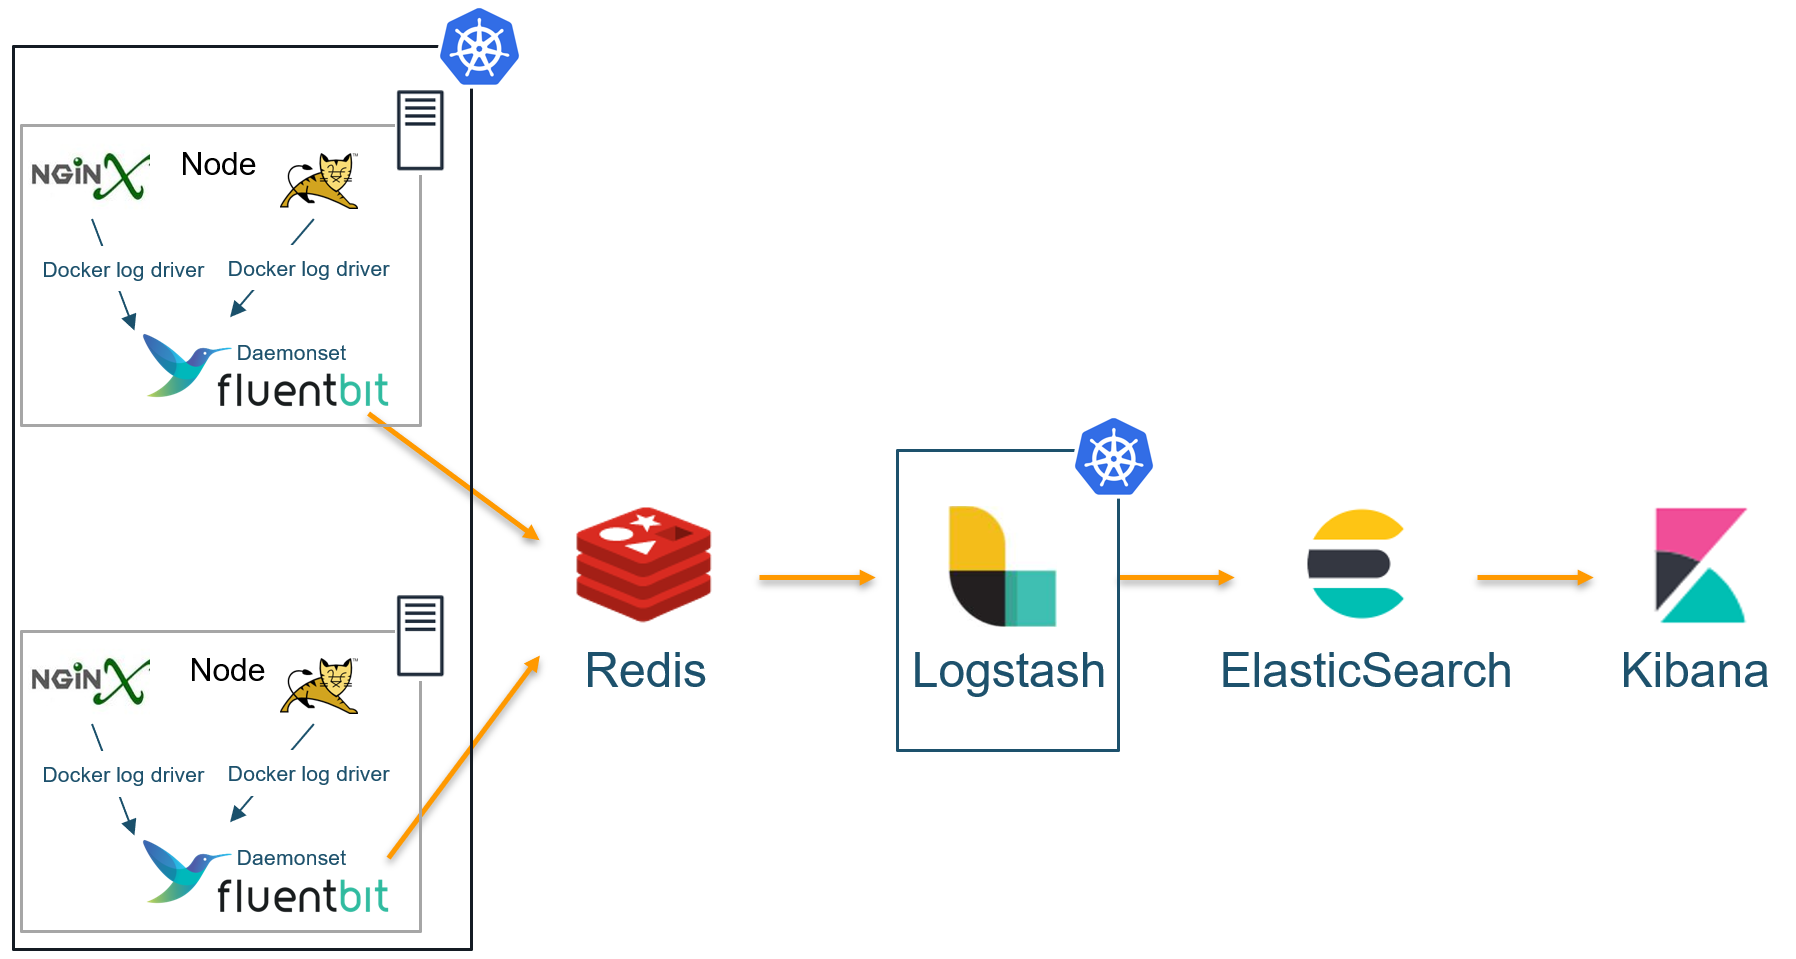
如果日志采集器收集的日志直接输出到日志解析器,在日志解析器负载较高时,会拖住日志采集器,因此建议在日志采集器和日志解析器中加一个缓冲队列。
本文以FluentBit为日志采集器、Redis为缓冲队列、Logstash为日志解析器为例,在Kubernetes集群下的搭建。
Redis、ElasticSearch、Kibana的搭建请参见相关文章,本文不再赘述。
如果日志采集器收集的日志直接输出到日志解析器,在日志解析器负载较高时,会拖住日志采集器,因此建议在日志采集器和日志解析器中加一个缓冲队列。
本文以FluentBit为日志采集器、Redis为缓冲队列、Logstash为日志解析器为例,在Kubernetes集群下的搭建。
Redis、ElasticSearch、Kibana的搭建请参见相关文章,本文不再赘述。
1、部署FluentBit
cat <<EoF > fluent-bit-go-redis.yaml
apiVersion: v1
kind: ServiceAccount
metadata:
  name: fluent-bit
---
apiVersion: rbac.authorization.k8s.io/v1beta1
kind: ClusterRole
metadata:
  name: pod-log-reader
rules:
- apiGroups: [""]
  resources:
  - namespaces
  - pods
  verbs: ["get", "list", "watch"]
---
apiVersion: rbac.authorization.k8s.io/v1beta1
kind: ClusterRoleBinding
metadata:
  name: pod-log-crb
roleRef:
  apiGroup: rbac.authorization.k8s.io
  kind: ClusterRole
  name: pod-log-reader
subjects:
- kind: ServiceAccount
  name: fluent-bit
  namespace: default
---
apiVersion: v1
kind: ConfigMap
metadata:
  name: fluent-bit-config
  labels:
    app.kubernetes.io/name: fluentbit
data:
  fluent-bit.conf: |
    [SERVICE]
        Parsers_File  parsers.conf
    [INPUT]
        Name              tail
        Tag               kube.*
        Path              /var/log/containers/*.log
        Exclude_Path      /var/log/containers/fluentbit*.log,/var/log/containers/logstash*.log
        Parser            docker
        DB                /var/log/flb_kube.db
        Mem_Buf_Limit     5MB
        Skip_Long_Lines   On
        Refresh_Interval  10
    [FILTER]
        Name parser
        Match *
        Parser nginx
        Key_Name log
    [OUTPUT]
        Name redis
        Match *
        UseTLS false
        TLSSkipVerify true
        Hosts redisserver:6379
        DB 0
        Key logstash
  parsers.conf: |
    [PARSER]
        Name   nginx
        Format regex
        Regex ^(?<remote>[^ ]*) (?<host>[^ ]*) (?<user>[^ ]*) \[(?<time>[^\]]*)\] "(?<method>\S+)(?: +(?<path>[^\"]*?)(?: +\S*)?)?" (?<code>[^ ]*) (?<size>[^ ]*)(?: "(?<referer>[^\"]*)" "(?<agent>[^\"]*)")? \"-\"$
        Time_Key time
        Time_Format %d/%b/%Y:%H:%M:%S %z
    [PARSER]
        Name        docker
        Format      json
        Time_Key    time
        Time_Format %Y-%m-%dT%H:%M:%S.%L
        Time_Keep   On
        # Command      |  Decoder | Field | Optional Action
        # =============|==================|=================
        Decode_Field_As   escaped    log
---
apiVersion: apps/v1
kind: DaemonSet
metadata:
  name: fluentbit
  labels:
    app.kubernetes.io/name: fluentbit
spec:
  selector:
    matchLabels:
      name: fluentbit
  template:
    metadata:
      labels:
        name: fluentbit
    spec:
      serviceAccountName: fluent-bit
      containers:
      - name: fluent-bit-go-redis
        image: majst01/fluent-bit-go-redis-output
        volumeMounts:
        - name: varlog
          mountPath: /var/log
        - name: varlibdockercontainers
          mountPath: /var/lib/docker/containers
          readOnly: true
        - name: fluent-bit-config
          mountPath: /fluent-bit/etc/
        - name: mnt
          mountPath: /mnt
          readOnly: true
        resources:
          limits:
            memory: 500Mi
          requests:
            cpu: 500m
            memory: 100Mi
      volumes:
      - name: varlog
        hostPath:
          path: /var/log
      - name: varlibdockercontainers
        hostPath:
          path: /var/lib/docker/containers
      - name: fluent-bit-config
        configMap:
          name: fluent-bit-config
      - name: mnt
        hostPath:
          path: /mnt
EoF
修改60行的Redis地址,然后再部署。
kubectl apply -f fluent-bit-go-redis.yaml2、检查Redis中的日志
用Redis客户端连上服务器,在配置的DB中,可以看到对应日志,否则使用kubectl logs ds/fluentbit进行排查。能看到日志即可进入下有一步。3、部署Logstash
用于从Redis获取日志,然后输出到ElasticSearch。cat <<EoF > logstash.yaml
apiVersion: v1
kind: ConfigMap
metadata:
name: logstash-config
labels:
app.kubernetes.io/name: logstash
data:
logstash.conf: |
input {
redis {
host => "redisserver"
db => "0"
data_type => "list"
key => "logstash"
}
}
filter {
grok {
match => { "message" => "%{COMBINEDAPACHELOG}"}
}
}
output {
elasticsearch {
hosts => ["ElasticSearchServer:9200"]
index => "nginx-log-%{+YYYY.MM}"
}
}
---
apiVersion: apps/v1
kind: Deployment
metadata:
name: logstash
labels:
app.kubernetes.io/name: logstash
spec:
selector:
matchLabels:
name: logstash
template:
metadata:
labels:
name: logstash
spec:
containers:
- name: logstash
image: logstash:6.8.8
volumeMounts:
- name: logstash-config
mountPath: /usr/share/logstash/pipeline/
volumes:
- name: logstash-config
configMap:
name: logstash-config
EoF修改第11行的redis地址和第26行的ElasticSearch地址。注意:第11行的redis地址不要带端口号,第26行的ElasticSearch需要带端口号,如果是默认https端口,需要加上443。然后执行kubectl apply -f logstash.yaml4、在ElasticSearch/Kibana中查看日志
前一步运行正常,即可在ElasticSearch/Kibana中看到日志,否则使用kubectl logs查看pod日志。0条评论
登陆后可评论